Uncover Hidden Insights using a powerful
Data Visualization Tool
Kato's rich data visualization puts the power of data in your hands with customized visualization
dashboards and reports to help you take data-driven decisions
Get Data Insights Instantly
-

Connect
Consolidate the data by connecting with all the data sources
-

Cleanup
Automatically correct data defects without affecting original raw data
-

Visualize
Create reports and visual dashboards using pre-built dashboard library
-

Insights
Let Kato's engine reveal the insights that you have been missing
Unleash the power of Data Visualization
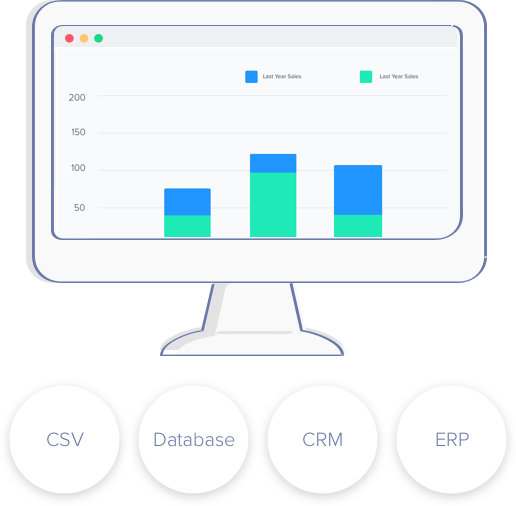
Connect to any data source
Skip the data preparation nightmare. With Kato's advance business intelligence technology, even non-techies can easily join large data sets from multiple & disparate sources, and create one neat and centralized repository of all data without any coding.
Free Sign Up
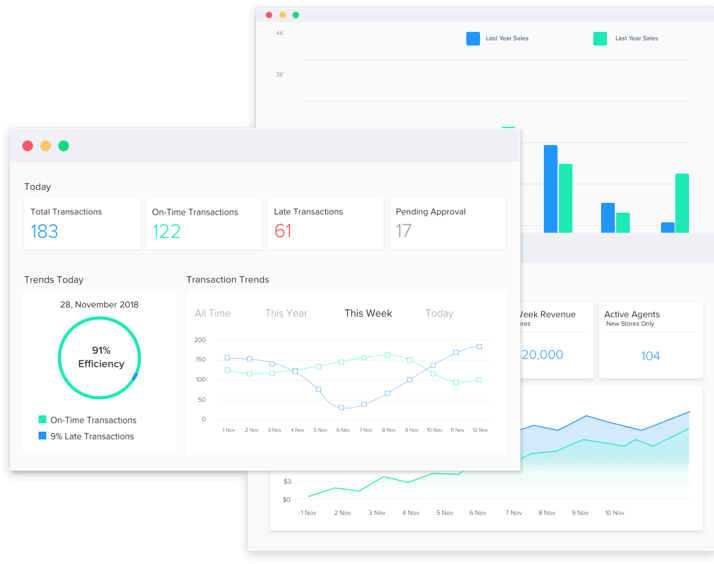
Pre-built visual dashboards
Immediate visual insight comes with the push of a single button in our pre-built dashboard library. Choose from dozens of predesigned data visualization widgets, get recommendations on the best ways to view the most important KPI's instantly.
Free Sign Up
Query big data at record-breaking speed
Kato is the only Big Data analysis and data visualization tool that empowers business users to prepare and analyze terabyte-scale data in minutes -100 times more data at 10 times the speed. Now, instantly discover hidden insights to rapidly take data-driven action.
Free Sign Up
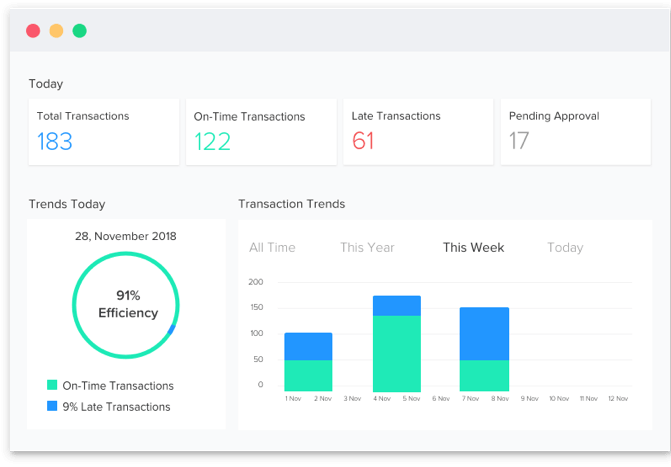
Customized Analytics Dashboard
Every company is different, and face unique data challenges on a daily basis. Generic metrics can’t provide the answers you need.
But with Kato, you can get those specific answers by analysing data from different sources on one fully-customized dashboard.
Free Sign Up
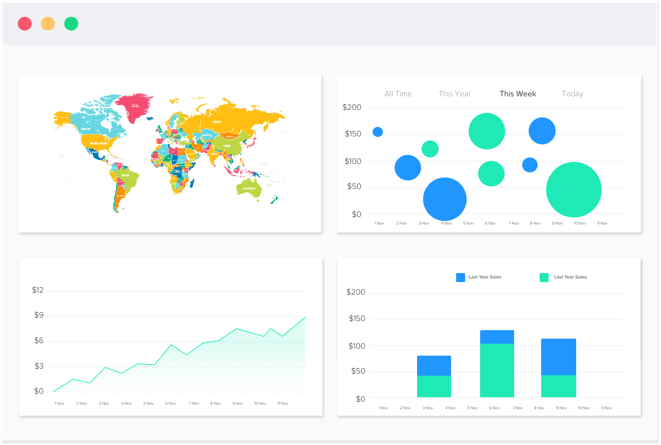
Create stunning visualizations
With Kato, the perfect data visualization is just a click away.
Understand your business from all perspectives with over 50 chart types – spatial maps for supply-demand, gauges to measure KPIs, line charts for trends, and pie charts for clear comparisons.
Free Sign Up
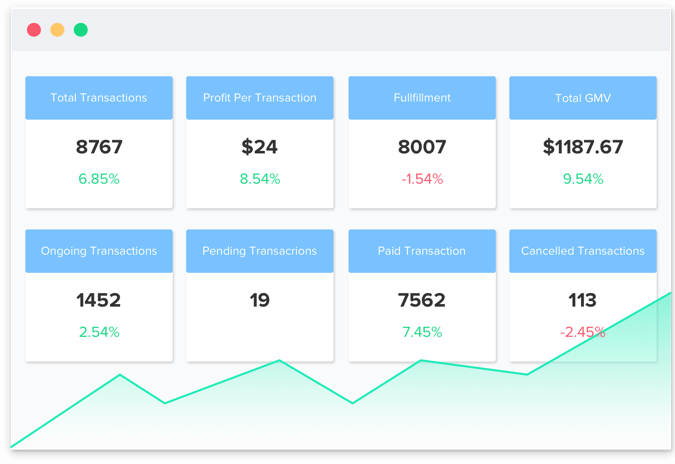
Receive insights as they happen
Your data is always changing and growing another day, another dollar. Kato's Real-time Analytics Dashboard provides advanced monitoring and analysing capabilities by allowing you to refresh and visualize key KPI's as often as you like.
Free Sign Up
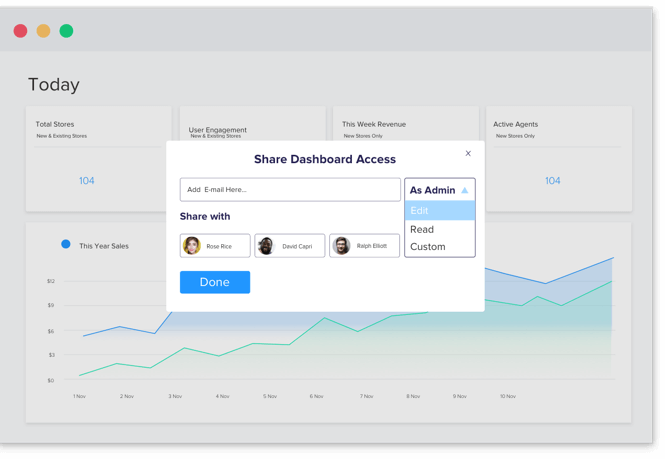
Share your dashboards securely
Imagine all the people collaborating on the same report, sharing the same insights. With Kato Visual & Custom Dashboards, Admins have permissions to deny or allow functionality access to specific users, maintaining data security at all times.
Free Sign Up
What our customers say
Jugnoo handles more than 1M transactions a month. Kato's intelligent BI platform helped us find interesting insights from data which really helped us increase our efficiency. It is fast, customised and delivered as a good quality product.
Chinmay Agarwal
JUGNOO
Case study
It was a refreshing experience to work with the Kato team. They are very fast, responsive and were able to build analytics and connect it with my product. I like it that they bring in there expertise to the table as well.
Ronald Wilson
BISTRO
Unexpectedly fast in execution, with submitting a world class product.
Nizar Debbs
KURDTAXI
Serving clients all over the world
Customers in over 180 countries are growing their businesses with Jungleworks.


 Close
Close